Know what the market
is actually worth.
More than 5,000 companies across 20 markets, from the US and China to Japan and Europe, ranked by market cap in USD and refreshed live. Fundamentals, valuation, dividends, macro, smart-money activity and an AI assistant, in the currency you think in. The world's markets in one place, free.
Runs in any browser. No download, no account needed to start.
Everything you need. Nothing you don't.
From the full ranked market down to a single company's statements. Prices, fundamentals, valuation and activity, in one fast place.
Every major market, ranked live
More than 5,000 stocks across 20 countries and 24 exchanges, ordered by market cap in USD and refreshed through the trading day. Over $130 trillion of combined value in one table, from Apple and Nvidia to Toyota, ASML, TSMC and Samsung. Dense, fast and built to scan: spot the leaders, the laggards and the movers in seconds.
- Live prices, market cap and daily change
- 30-day sparklines on every row
- USD plus local prices on foreign listings, or pick your own display currency

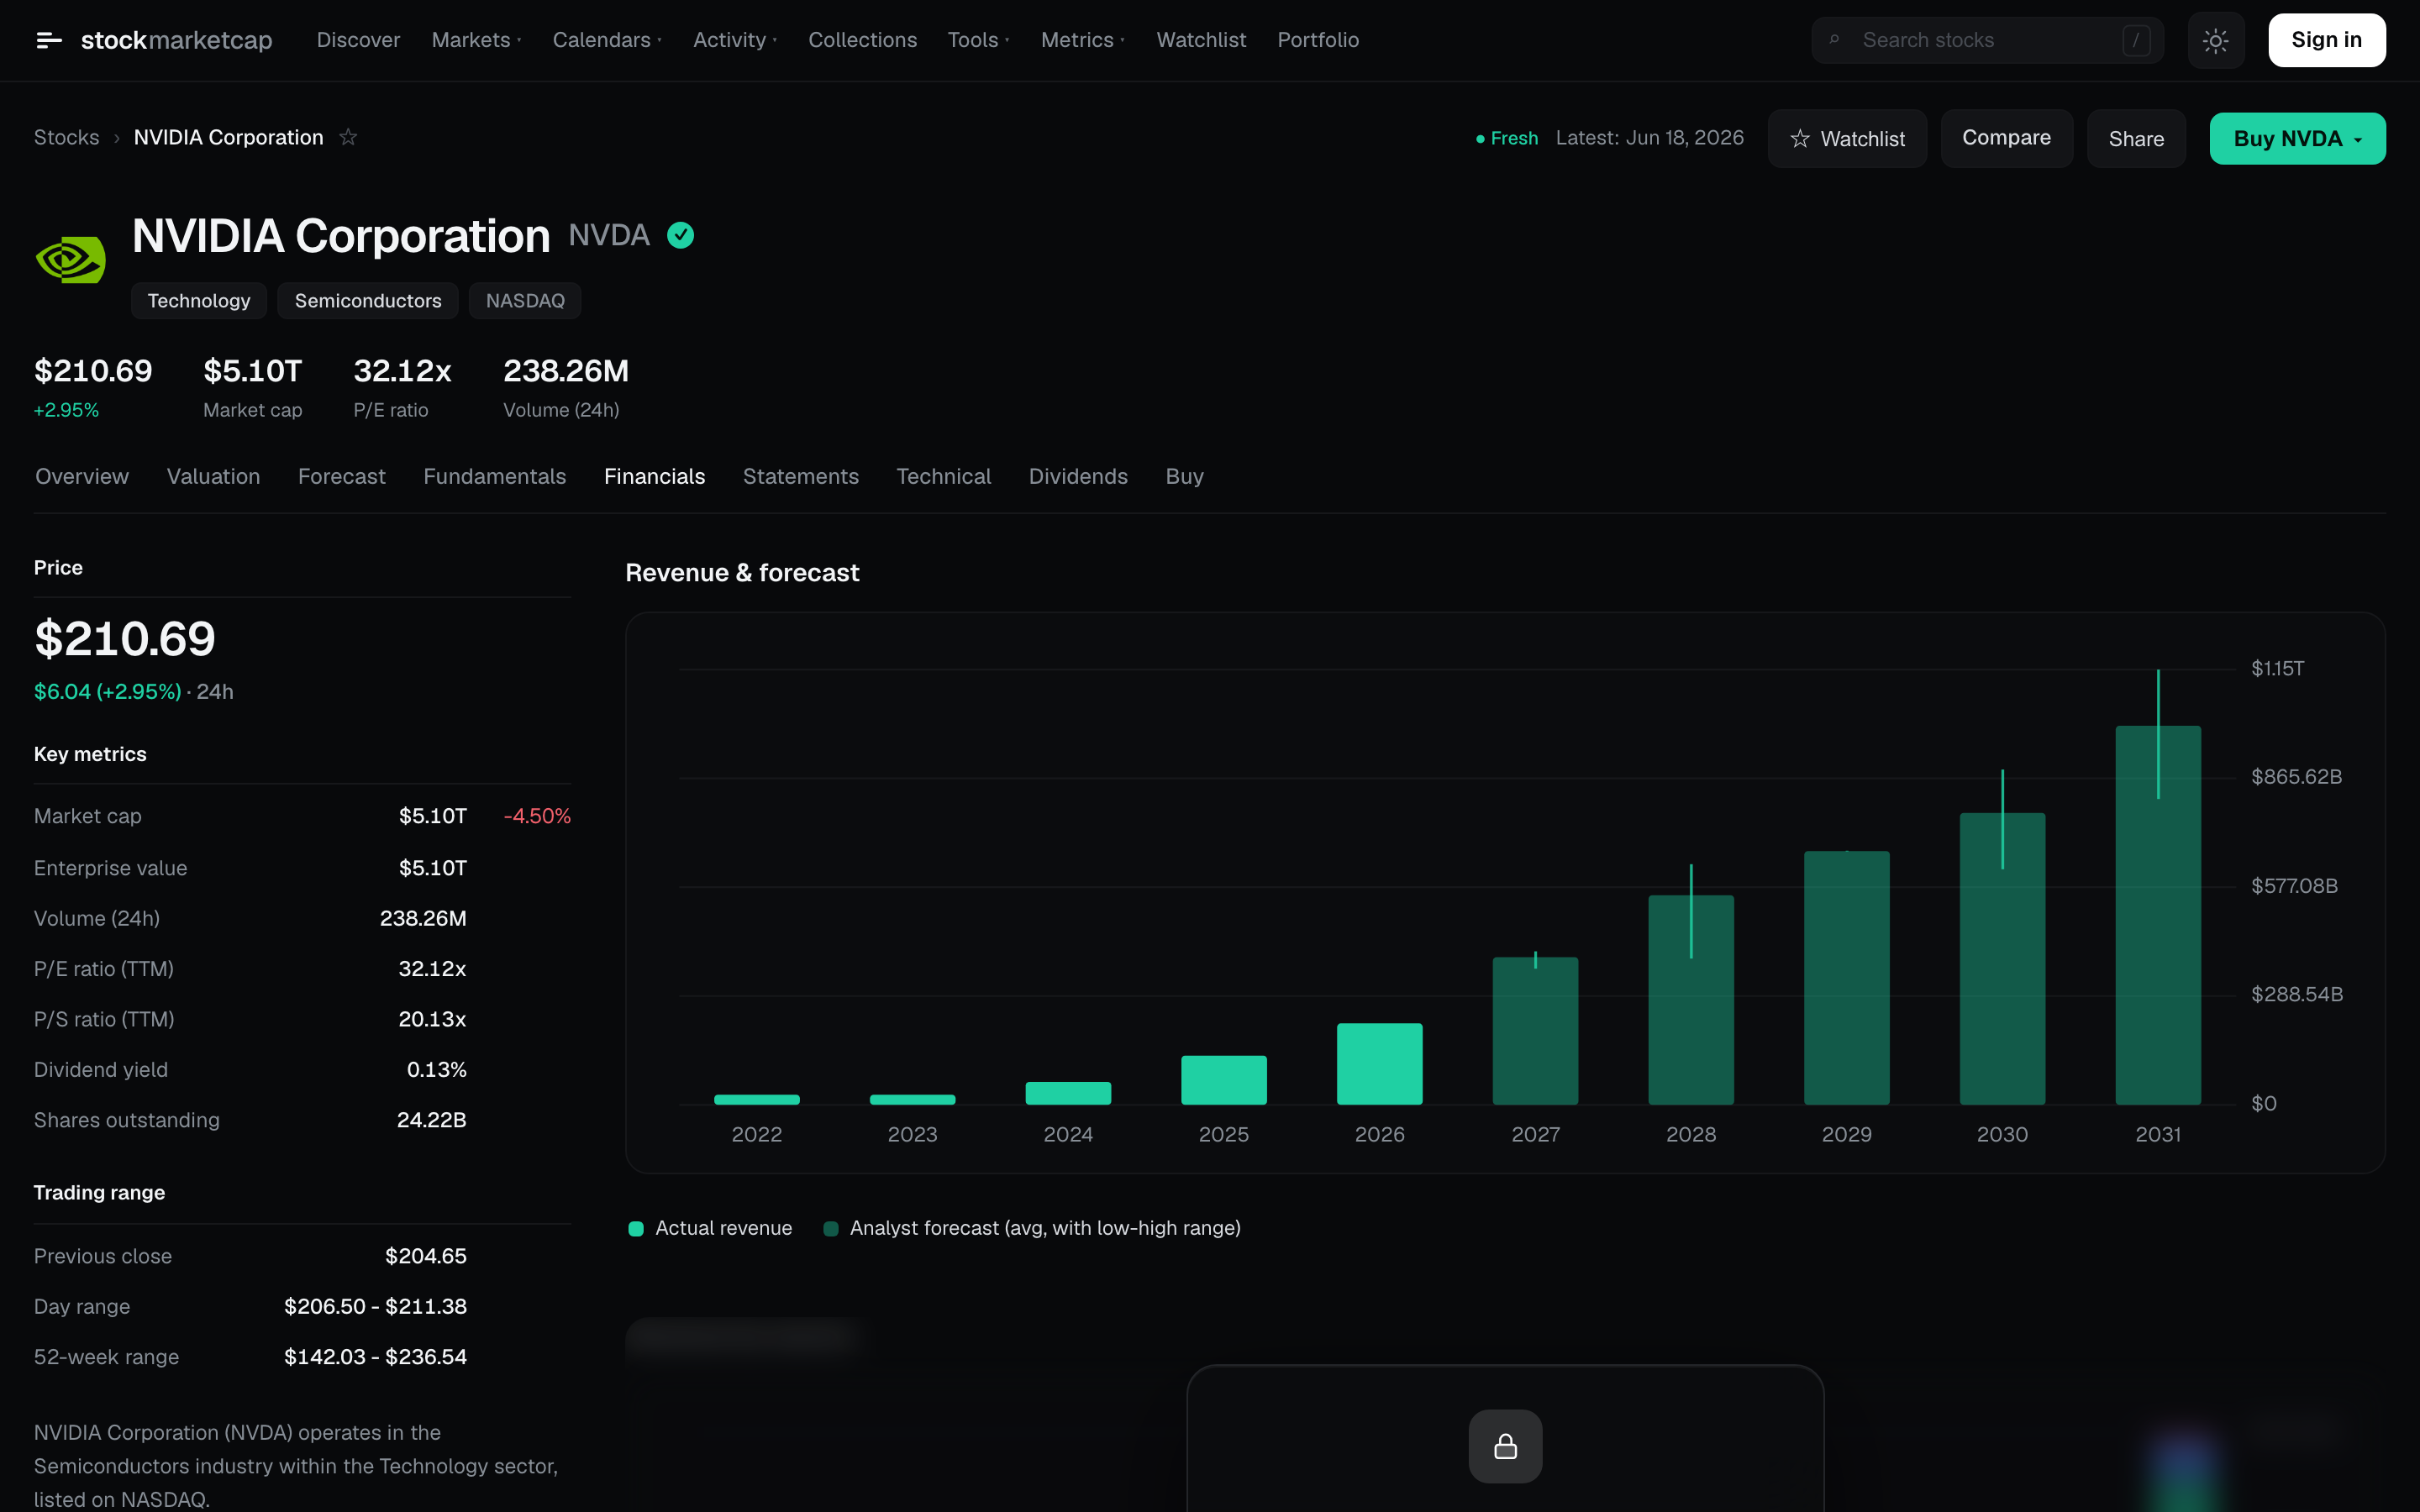
Go deep on any stock in one page
Open any ticker for revenue and earnings trends, analyst forecasts, valuation multiples, dividend history and the full financial statements. The whole story, no twelve tabs.
- Revenue and earnings with analyst forecasts
- P/E, P/S and enterprise-value multiples
- Dividend yield, history and full statements
- Compare any two stocks and backtest returns
Find the next idea before the crowd
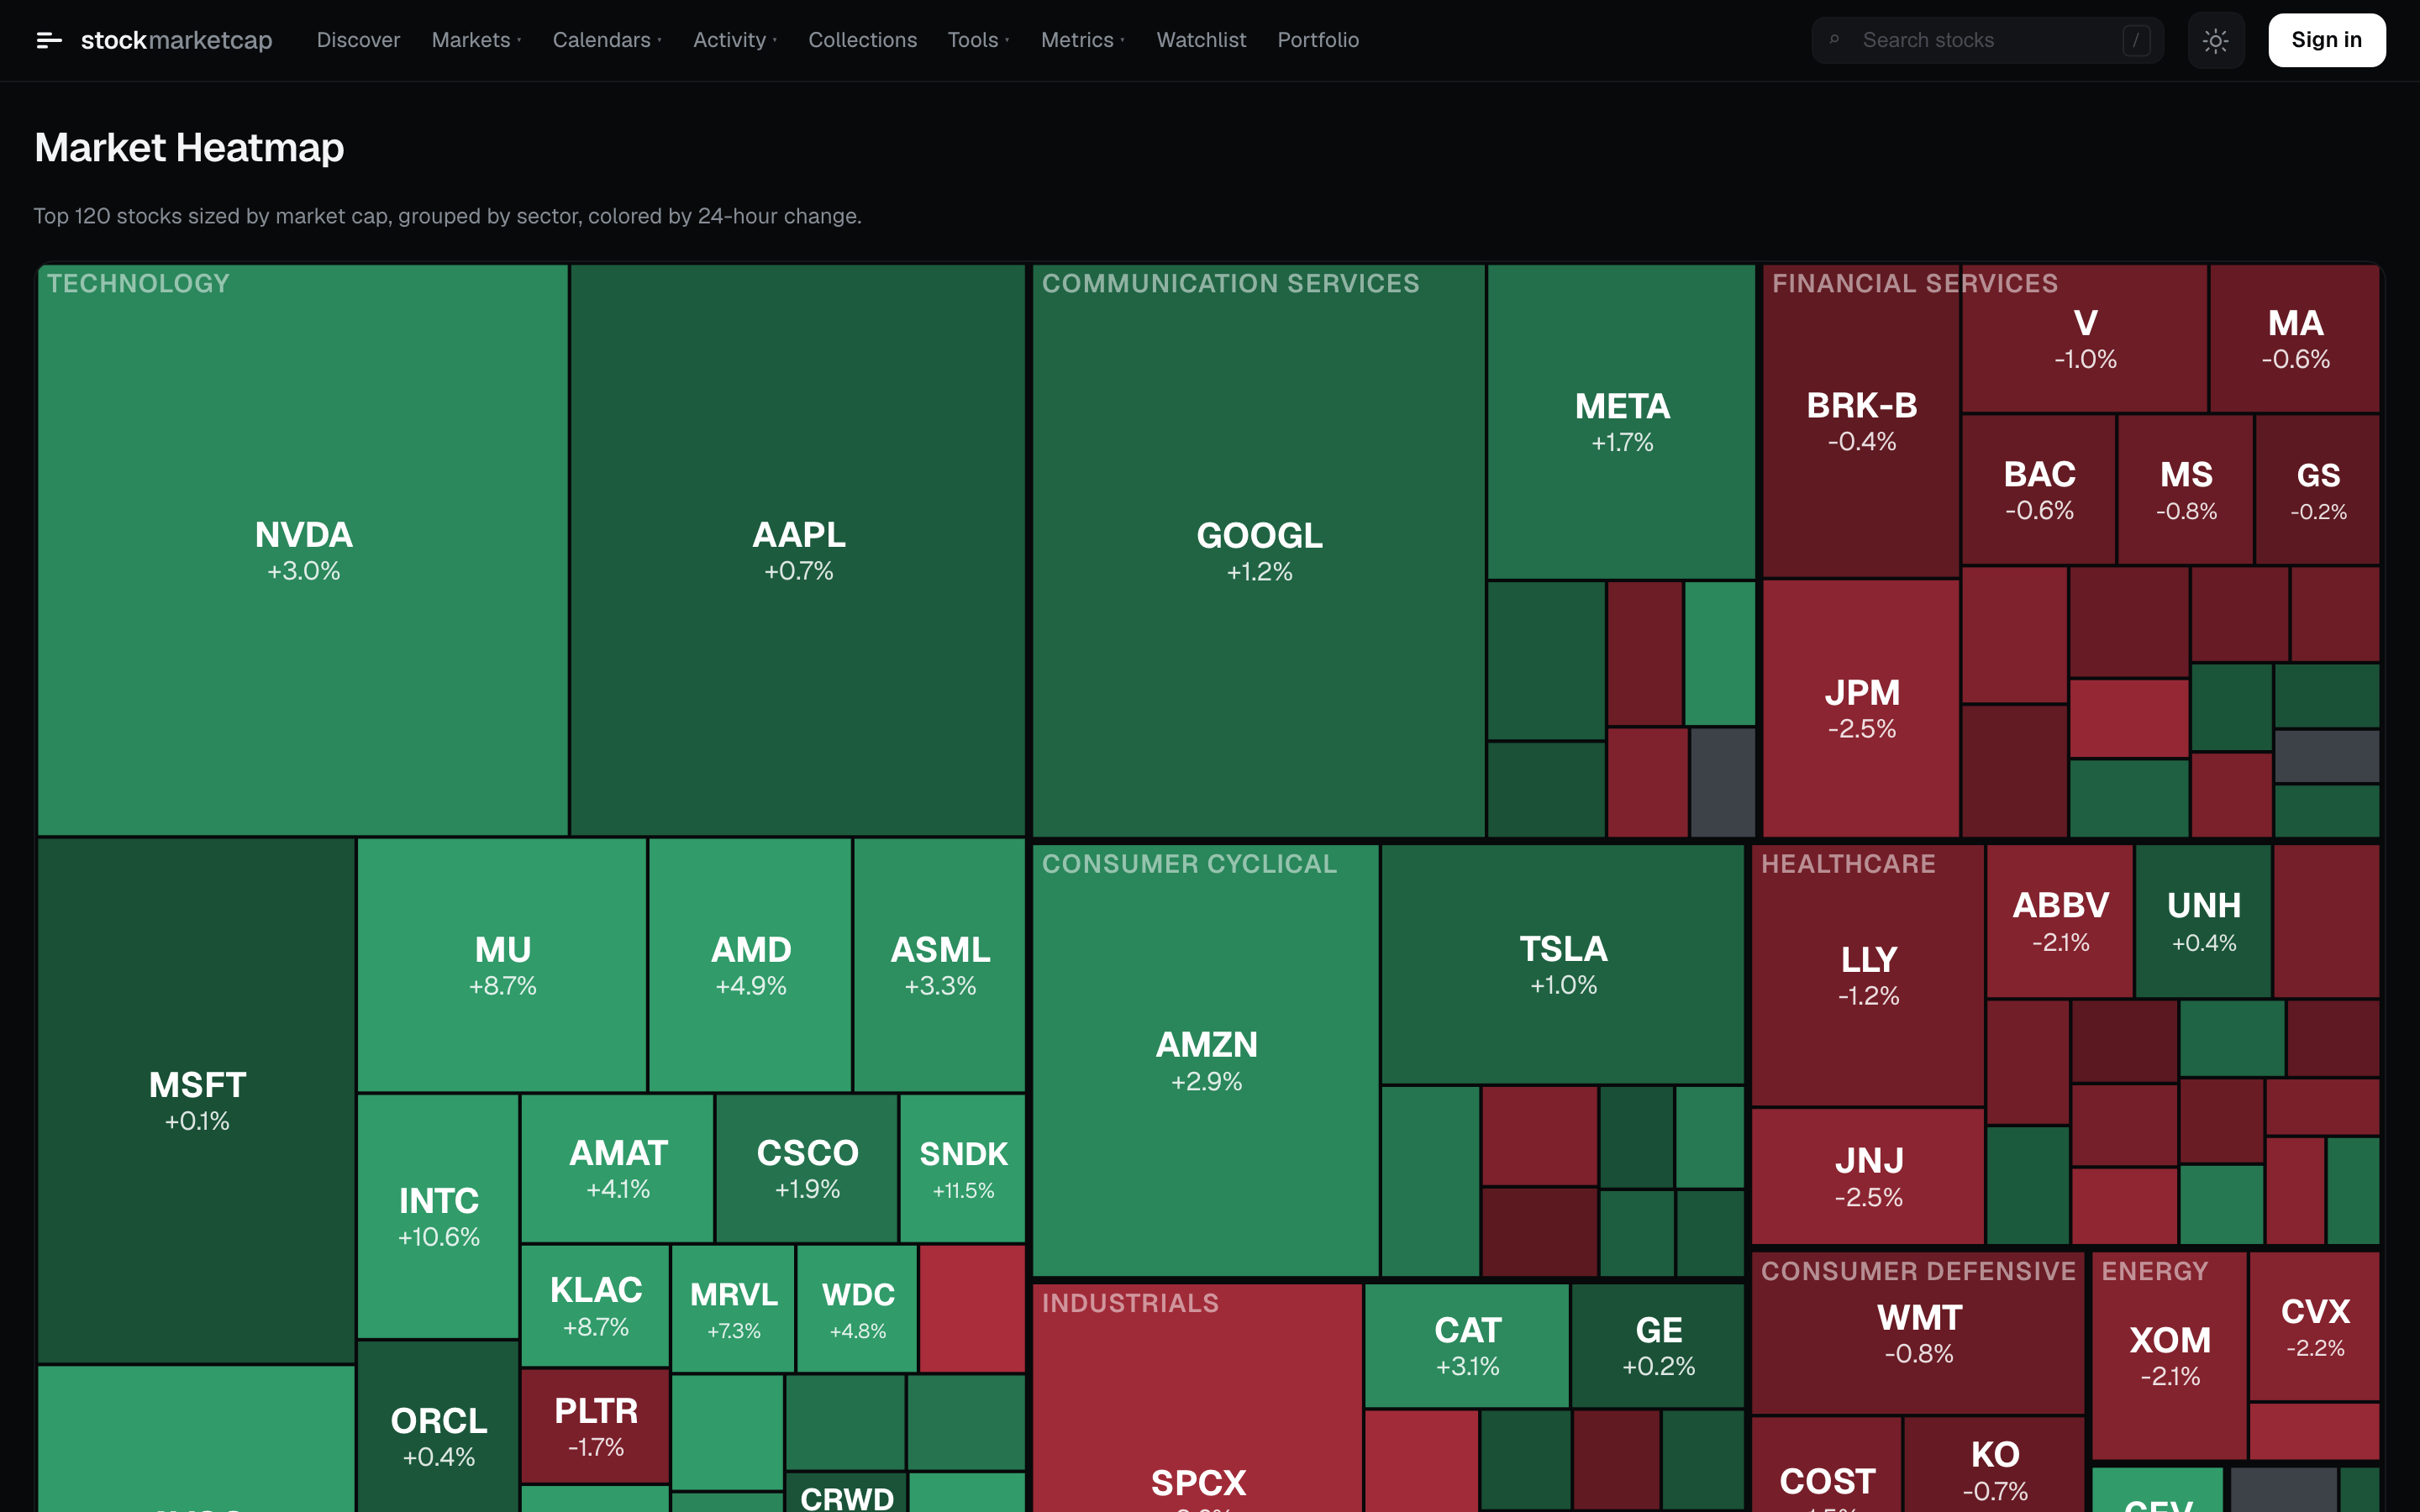
Build custom screens across price, valuation and fundamentals, read the whole tape at a glance in the sector heatmap, and keep the macro picture close: yields, economic events and every date that matters.
- Multi-filter screener with custom columns
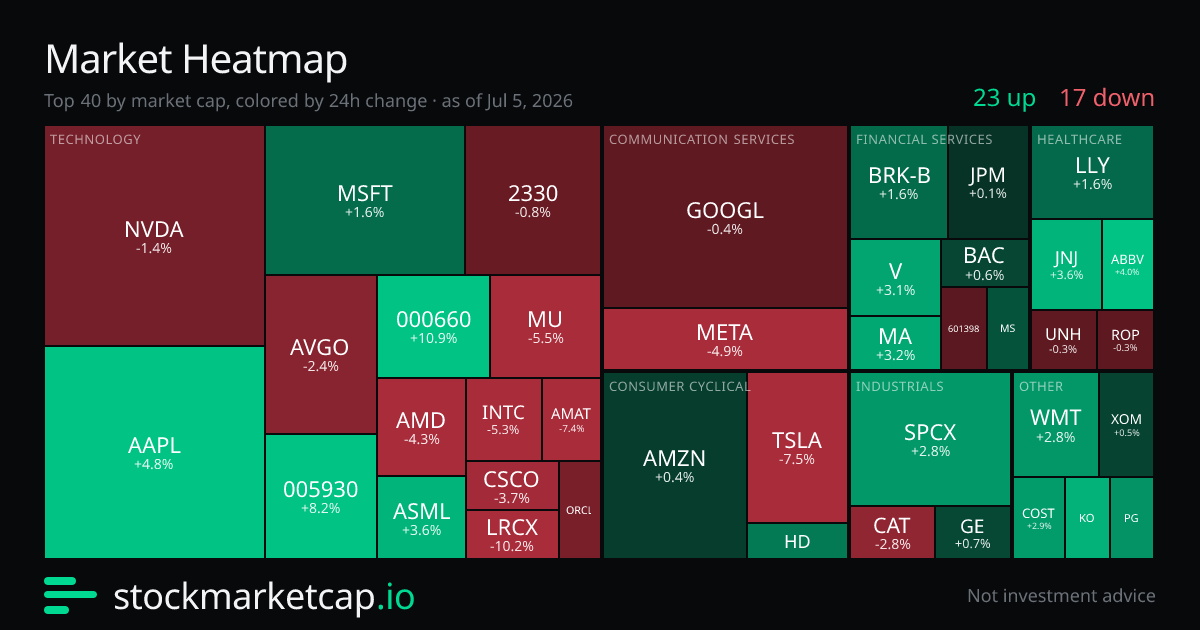
- Color-coded market heatmap by sector
- US treasury yield curve and a global economic calendar
- Earnings, dividend and IPO calendars
- Curated collections by theme, country and region
Track your book, flex your gains
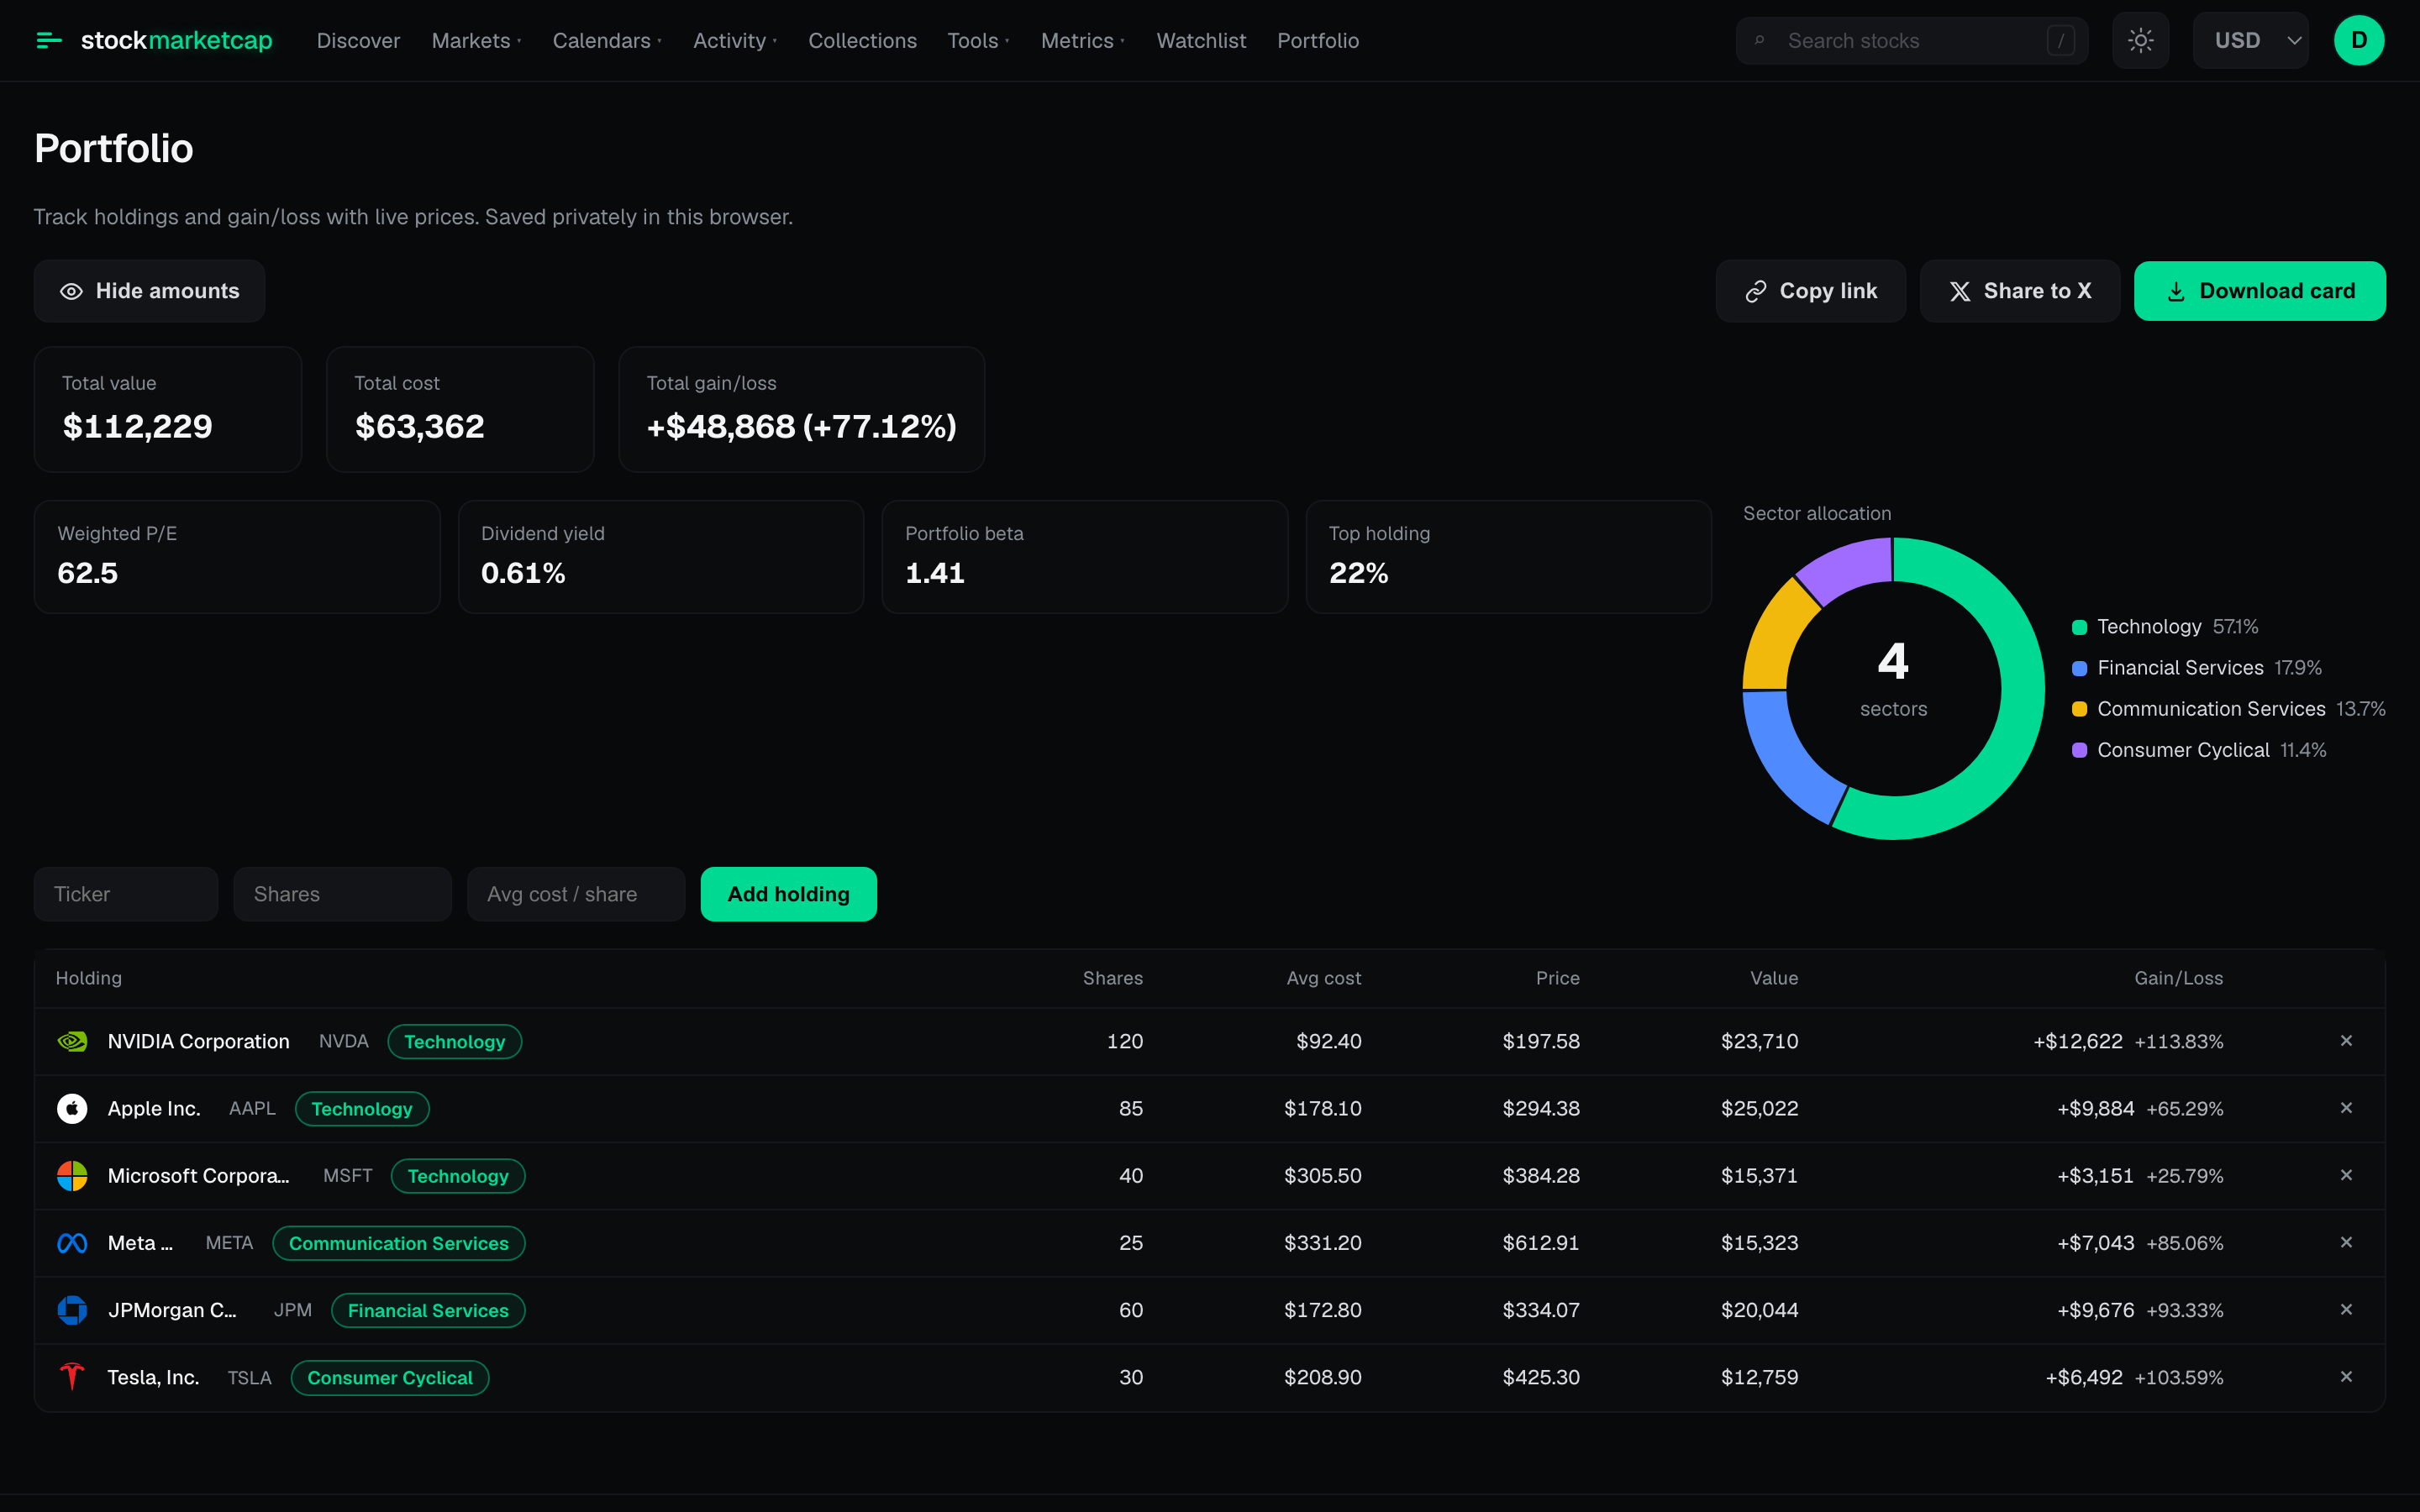
Sign in to save a watchlist and track a real portfolio. Watch live profit and loss on every holding, see your sector allocation at a glance, and share a clean P&L card in a single tap.
- Watchlist and portfolio synced across devices
- Live profit and loss on every holding
- Sector allocation breakdown of your book
- Shareable P&L card, ready to download or post
See what the smart money is doing
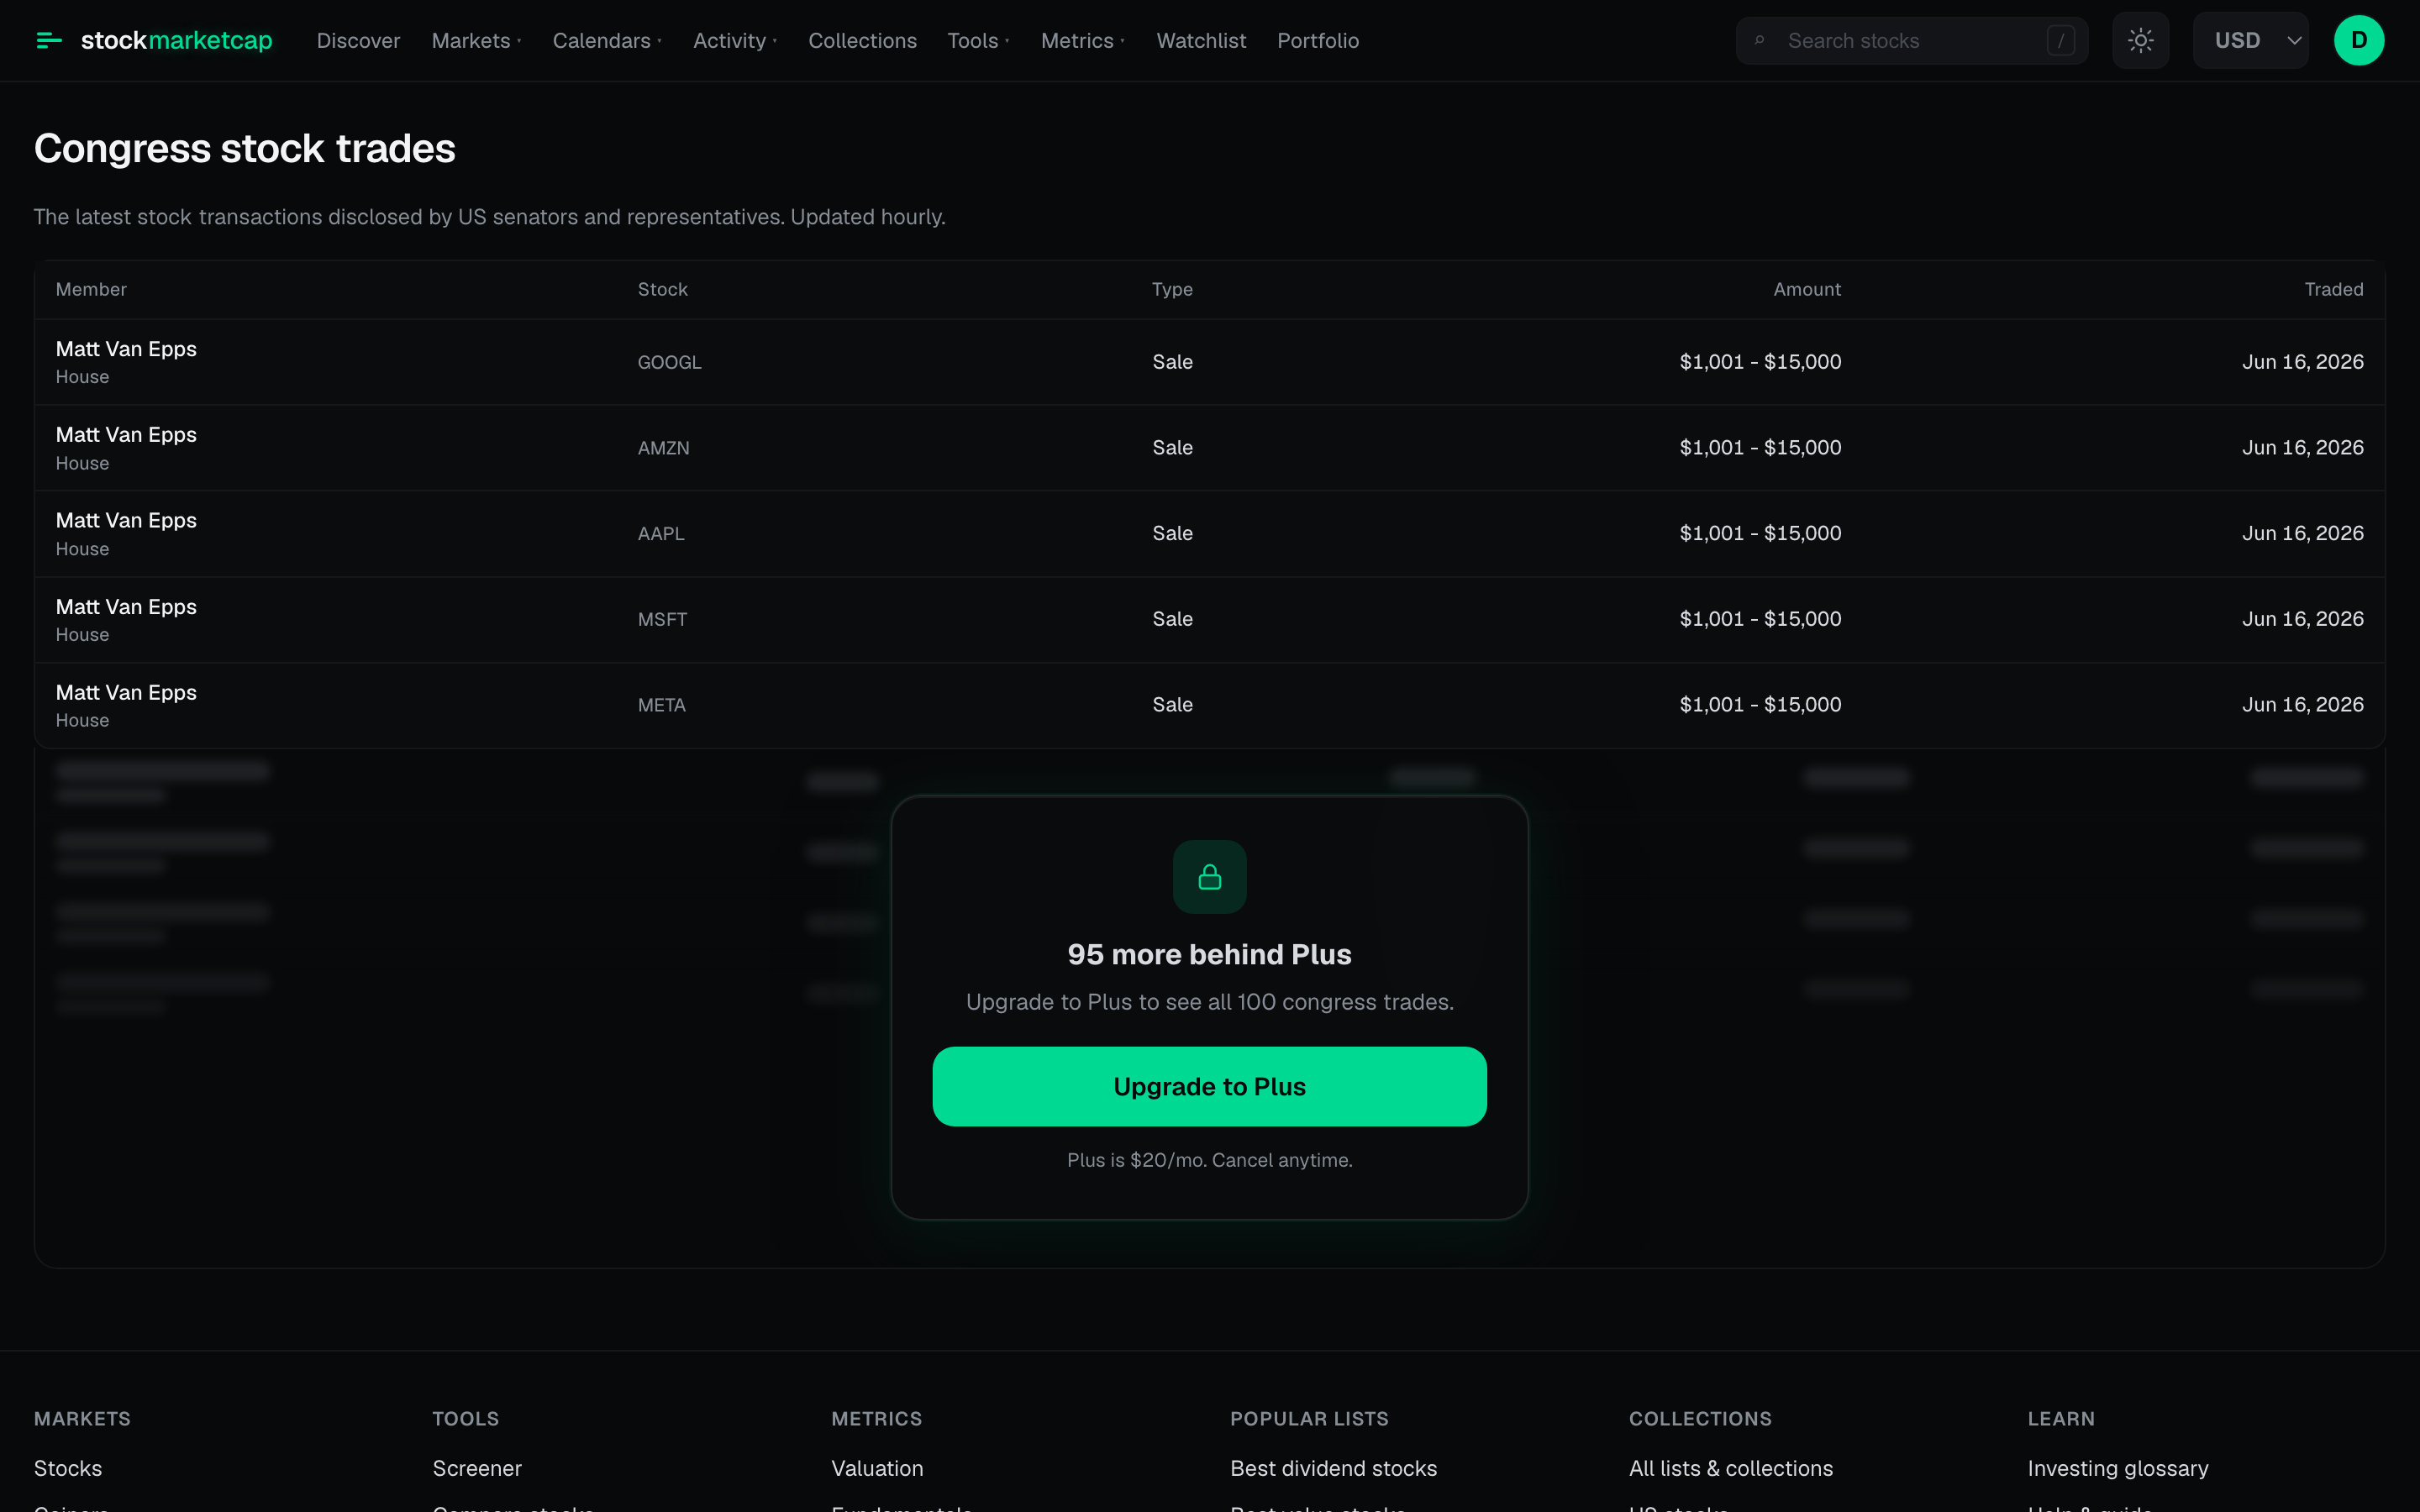
Follow who is actually buying and selling. Congressional trades disclosed under the STOCK Act, insider buys and sells with clustered-buying signals, analyst upgrades and downgrades, and the 13F filings that reveal which funds hold a stock. Across the whole market, and on a dedicated smart-money tab on every stock page.
- Congressional trades disclosed under the STOCK Act
- Insider filings with cluster-buy detection
- Analyst upgrades, downgrades and price targets
- 13F institutional holders, positions and entry dates
Made to be shared
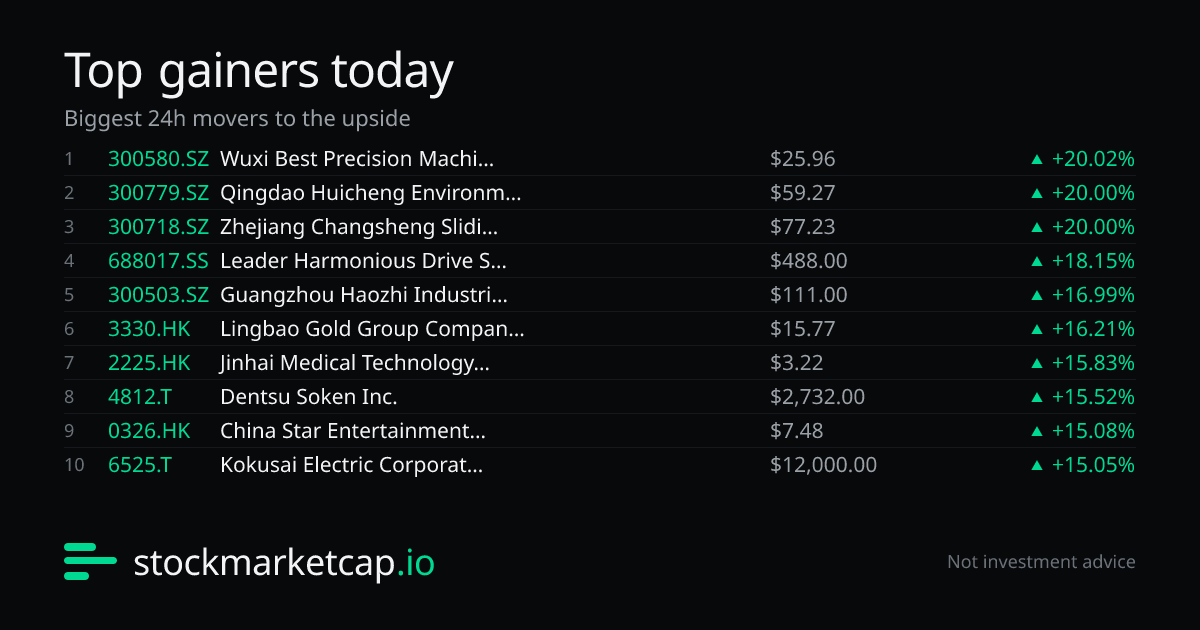
Almost every table and chart becomes a clean, branded card you can download or post in a single tap: heatmaps, movers, valuations, dividends, smart-money feeds and your own portfolio. Signed-in cards carry your own @handle watermark.
An analyst in your pocket
Ask anything about a stock, a metric or the market and get a clear, plain-English answer grounded in real data. Tap a question below to see it in action: no login required.
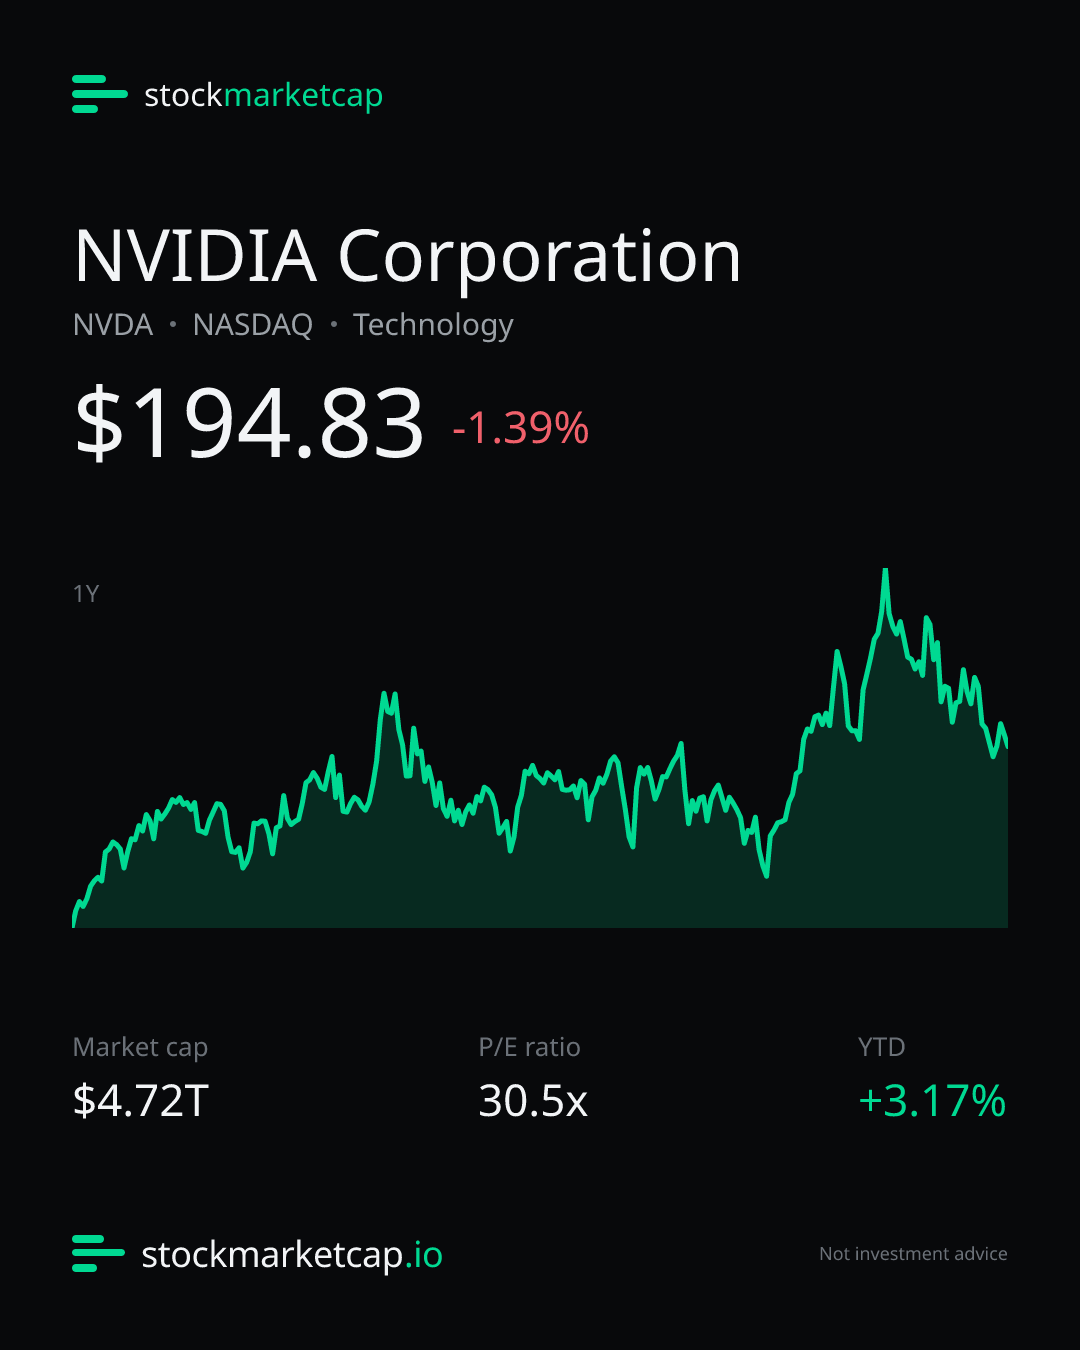
$NVDA trades at $194.83 with a $4.72T market cap. Here is how that valuation stacks up:
- 30.5x earnings against a median of 83x across large-cap semiconductors. By its own sector's standard, it is on the cheap side.
- 19x sales, carried by a 63% profit margin. The margin is what pays for the multiple.
- The street: 60 analysts rate it a buy, 16 hold, 3 sell, with a $317 consensus target.
Expensive against the market, cheap against its peers. You decide.
Sample answers from a July 2026 snapshot. The live assistant pulls current numbers. Not investment advice.
The live assistant answers any question in real time. Free to use after you sign in: 5 free messages, then Plus.
A Bloomberg Terminal, but better
The Bloomberg Terminal is the gold standard for market data, and it costs roughly $24,000 to $25,000 per seat a year, built for Wall Street pros. StockMarketCap gives you terminal-grade insight on the world's stock markets that you just ask for in plain English, in any browser, free or $20 a month, for everyone.
- Price~$24k to $25k per seat, per year
- AudienceWall Street pros and institutions
- InterfaceA dense terminal with a steep learning curve
- AccessLocked to the terminal and an expensive seat
- PriceFree, or $20 a month for Plus
- AudienceEveryone, from first trade to full-time
- InterfaceJust ask in plain English
- AccessAny browser, any device, nothing to install
- Live market caps and prices
- Deep fundamentals
- Screener
- Sector heatmap
- Analyst actions
- Insider trades
- Congress trades
- Charts
Not a Bloomberg Terminal replacement: StockMarketCap focuses on public equities and does not cover fixed income, FX or a full news terminal. “Better” means more accessible, more affordable and conversational, not identical features. Bloomberg pricing is widely reported and approximate. Information only, not investment advice.
Take the whole market anywhere
The same live rankings and research, tuned for your phone. The iOS app is in final testing. Use it in your mobile browser today.


Start free, upgrade later
The full research experience is free today. Plus adds unlimited tracking, premium fundamentals and the full smart-money record.
Everything you need to research the market.
- Full market-cap rankings, live prices
- Financials, valuation and dividends
- Screener, heatmap, macro and calendars
- Watchlist and portfolio
- Recent insider, congress and analyst activity
For power users who want more depth.
- Unlimited watchlist and portfolio
- Premium fundamentals: DCF, forecasts, valuation bands and full statements
- Returns backtester and advanced compare
- Full congress, insider and 13F history
- Ad free
Plus is available now. See plans and manage billing on the pricing page. Everything in Free is available today, no account required to browse.
Good questions
Everything else you might be wondering before you dive in.
The market is moving. Don't miss it.
No download, no paywall. Open the app and explore 5,000+ stocks across 20 global markets, ranked by market cap, live, right now.
The data speaks for itself
Every hour, @stocksmcap posts the same branded cards straight from the platform: the day's biggest movers, fresh 13F filings, insider and congress activity, sector heatmaps. No hot takes, just the numbers.
@stocksmcap